Do You Feel Lucky? A Large-Scale Analysis of Risk-Rewards Trade-Offs in Cyber Security
Yan Shoshitaishvili, Luca Invernizzi, Adam Doupe, and Giovanni Vigna UC Santa Barbara Santa Barbara, CA, USA {yans,invernizzi,adoupe,vigna}@cs.ucsb.edu
ABSTRACT
A crucial part of a cyber-criminal's job is to balance the risks and rewards of his every action. For example, an expert spammer will tune a bot's email-sending rate to achieve a good throughput with an acceptable risk of being detected. Then, such a cyber-criminal has to choose how to launder the money he made with spamming, and he will have to consider many options (money mules, Bitcoin, etc.) that will offer different returns and risks. Although understanding these trade-offs and coming as close as possible to their optimum is what discriminates winners and losers in the cyber-crime world, there has been little study on this matter, as setting up a large-scale study to study how cyber-criminals deal with these risk-reward trade-offs is challenging.
Computer security competitions provide a great opportunity both to educate students and to study realistic cybersecurity scenarios in a controlled environment. Looking to study the risk-reward trade-offs seen in real cyber-security incidents, we designed and hosted a novel format for a Capture the Flag cyber-security contest, involving 89 teams comprising over 1,000 students across the globe. In this paper, we describe the intuition, intent, and design of the contest. Additionally, we present an analysis of the data set collected, evaluate its effectiveness in modeling risk-reward behavior, examine the strategies of the competing teams, and estimate the effectiveness of such strategies.
1 Introduction
Computer security incidents commonly display a risk-reward trade-off. Examples of this in the wild are plentiful: a spear-phishing campaign might target an increased amount of users at the cost of an increased risk of being reported, or a bot could send spam at a higher frequency and risk being blacklisted. Studying this trade-off could provide valuable insight into the decisions that cyber-criminals make when designing exploitation software and methods. However, the collection of real-world data on these topics is difficult, and the reproduction of these scenarios for study in a controlled environment has been an open problem. Seeing the poten-
Permission to make digital or hard copies of all or part of this work for personal or classroom use is granted without fee provided that copies are not made or distributed for profit or commercial advantage and that copies bear this notice and the full citation on the first page. To copy otherwise, to republish, to post on servers or to redistribute to lists, requires prior specific permission and/or a fee.
Copyright 20XX ACM X-XXXXX-XX-X/XX/XX ...$10.00.
tial for leveraging cyber-security competitions to generate realistic models and datasets [4], we designed and organized an experiment, disguised as a "Capture the Flag" exercise, to generate a public dataset to assist in studying risk-reward behavior.
A "Capture the Flag" (CTF) competition is a cyber-security exercise in which every team is both an attacker and a target. Generally, the completion of an attack by a participating team results in a reward of points, and the team with the most points at the end of the competition wins. The twist in our competition was that, in order to score the most points, the participants had to make risk-reward trade-offs, which in turn were designed to model trade-offs faced by cyber-criminals in the course of their actions. Our experiment involved 89 academic teams from around the world, comprising over 1,000 students. We analyzed this dataset to uncover the behavior of teams when faced with a risk-reward trade-off. Using this data, we have attempted to recreate the strategy that some of the top teams used and their level of accepted risk. Specifically, we have shown that the teams did, in fact, give thoughts to the risk inherent in their actions. Furthermore, the teams that understood this risk were able to use their understanding to improve their standing in the competition, validating the success of our design.
In this paper, we make the following contributions:
- We describe the novel design of a research experiment on risk-reward trade-offs in the form of a live cyber-security exercise.
- We analyze the data generated by the players' participation in our experiment, describing team strategies and insights into risk-reward trade-offs made by the participants.
In addition to these contributions, we have made the dataset itself available for use by other researchers so that they can further study other aspects of the risk-reward tradeoffs than we were able to do here [7]. While this dataset is not a perfect simulation of cyber-criminal behavior (after all, the student participants were not, actually, professional cyber-criminals), we have put the participants in the shoes of cyber-criminals, staging a scenario similar to the one cybercriminals face every day. Moreover, we have had participants with a wide range of expertise, ranging from researchers in the field of Computer Security to amateurs (much like cybercriminals range from skilled professionals to "script kiddies"). To our knowledge, this is the only existing large-scale dataset that attempts to represent risk-rewards trade-off choices in Computer Security. Aside from implications in the field of Computer Security, we believe this dataset would be useful in other areas, such as game theory or optimization. In fact,
this dataset has already been used by other research groups to study visualizations of cyber-security incidents [10].
2 Background
We centered our CTF design around a risk-reward tradeoff because of the ubiquitous nature of trade-offs in cybersecurity. In this section, we describe why this trade-off is important and detail its implications on some of the history of computer security. We also present some details of other cyber-security competitions to provide some context about educational security exercises.
2.1 Risk-reward trade-off
A trade-off between risk and reward is a common element in many issues pertaining to computer security. Aspects of this trade-off can be seen in worms, drive-by downloads, and spamming. In all of these examples, cyber-criminals face a trade-off between being effective and being stealthy.
One obvious example of this is in the fall in popularity of classical self-spreading worms [1]. In the early 2000s, worms, which spread by taking advantage of remotely-exploitable vulnerabilities in various commonly-used software products, achieved huge success at compromising and utilizing a very large number of machines. However, the spread and infection model of such worms is extremely easy to detect, and techniques were developed to effectively achieve such detection [6]. In recent years, self-spreading worms have plummeted in efficacy, and are no longer a serious computer security threat1.
Cyber-criminals quickly moved away from using a worm-like infection vector, and began to instead utilize drive-by downloads [8]. This approach carries a considerably smaller risk of detection, as the malware delivery vector is not easily distinguishable from ordinary web traffic. However, a trade-off of the rate of new infections must be made: botnets built with such methods grow slower than those built using worms.
As drive-by downloads increased in popularity, systems were developed to detect such attacks [3,8]. Here, cybercriminals were faced with another risk-reward trade-off. Most drive-by download detection systems utilize a rich honeyclient system that emulates a web browser. Because such detection systems have finite resources, certain decisions have to be made as to which set of browsers to emulate. Among other methods, cyber-criminals can evade detection of their drive-by downloads by identifying the browsers emulated by the detection systems and avoid sending the malicious code to such browsers [9]. This method, while it can help cybercriminals to avoid detection, again comes at a cost.
Yet another interesting case of risk-reward trade-off is seen in spamming operations. Spammers generally use precompiled email lists to select their targets in spam campaigns. Additionally, as such campaigns progress, emails that are continuously found to be non-existent (through mail-server feedback), are removed from the spam lists. This is done by spammers with the goal of cleaning up their email lists, so that they do not waste resources sending emails to accounts that do not exist. However, this approach can raise the risk of spam mitigation methods that target this mechanism to the spammers' disadvantage. This approach has been
implemented and tested by anti-malware researchers [11], demonstrating that this is indeed a very relevant trade-off between risk and reward for the spammers.
2.2 Capture The Flag Competitions
A Capture the Flag (CTF) competition is a live security exercise comprising a number of cyber-security challenges. Successful completion of such challenges yields a key (called the flag) that the successful player can usually redeem for points. Such competitions are frequently played by teams of people as a type of cyber-security-based team sport.
The origin of the CTF concept can be traced back to the DEFCON security conference, held yearly in Las Vegas, Nevada. DEFCON started in 1992 and formalized the CTF concept in its fourth year. Since then, the concept has spread around the world, and several CTFs are held every month worldwide.
While CTF competitions are mostly held for the enjoyment of the organizers and teams (similar to amateur sporting events), they can be leveraged for data collection. For example, cyber-security companies frequently host CTFs as a recruitment tool2. Additionally, Pwn2Own3, an event in which participants must hack into computers with specific software configurations, is used by the vendors of such software as a penetration-testing event.
CTF competitions, such as our experiment, can also serve as tools to educate students. As computer security becomes an increasingly important issue for corporations and governments, the question of training the next generation of security professionals rises in significance.
Practical security education started with early efforts by Computer Science professors to teach applicable security practices, introducing students to topics such as buffer overflows, SQL injections, and related security concepts. These methods, however, constitute a passive way of learning computer security and do not adequately prepare students for challenges that they might face in real-world security scenarios. To improve and enhance the security education of computer science students, educational cyber-security competitions were introduced to motivate students and to perform live exercises in a controlled environment. This controlled environment is important, as it allows students to fully exercise offensive security skills without the risk or worry of illegality.
3 The Experiment
To study risk-reward choices in a realistic scenario, we staged an experiment, disguised as a CTF competition, that required teams to create policies and make decisions in a risk-aware fashion. We choose a theme centered around illegal money laundering for our competition. This activity is modeled after cyber-criminal money laundering operations and implements some of the ideas presented in Section 2.1.
The theme of the competition was that each team was a "gray-hat" hacker who had the challenge of laundering dirty money (termed money) into clean money (termed points). This was done by the completion of specific security-related tasks. In this way, the theme was created after the goal of the contest: analyze the way in which people approached a risk-reward trade off in a computer security situation.
<sup>1</sup>Or at least, not at the level that they once were, infecting massive amounts of machines in a short time-frame. While some modern botnets spread via worm-like functionality, they are clearly not on the level they once were.
2https://stripe-ctf.com/
http://pwn2own.zerodayinitiative.com
3.1 Design Goals
Several ideas influenced the design of our contest, called the Educational Live Security Exercise (ELSE). The most important consideration, of course, was the development of a competition to properly model the risk-reward trade-offs described in Section 2.1. However, an additional consideration was the assurance of a fair and exciting competition. In many CTF competitions, one team dominates the entire competition by utilizing experience in a specific field, completely ignoring whole portions of a competition. This imbalance is especially common in competitions that include both a team-vs-team and a challenge board component, as it is often possible to strategize in a way that allows a team to ignore one of the components. We wanted all aspects of our competition to be important, so we devised a competition format that would put heavy emphasis on both team-vs-team competition, and on the challenge board.
In a similar vein, we wanted to prevent a team from skyrocketing in points and creating an unassailable lead, because this can have the effect of discouraging other players. In many CTFs, one team will frequently pull ahead early on and maintain a dominant lead until the end, making the CTF much less interesting for everyone else involved. We wanted to promote a format where teams that pulled ahead had to fight to maintain their position.
Finally, we wanted our CTF to educate participating students, not just on the core aspects of practical computer security, but on the perspective of hackers when evaluating risks against rewards. By making this concept of risks and rewards explicit in our competition, we believe that the students developed an understanding and intuition of risks and trade-offs far better than they would have in a class. We hope that the next time these students analyze a piece of malware or research the underground economy they will be able to better assess the hackers' motivations and, therefore, predict the hackers' possible responses.
3.2 Design Overview
The key game mechanic of our competition was the conversion or laundering of dirty money into clean points. At the end of the game, the team with the most clean points was the winner, and dirty money was not considered.
The teams earned dirty money by solving security challenges, described in Section 3.3.3, from a challenge-board. This dirty money could only be laundered into clean points by successfully exploiting vulnerable network programs, known as services and described in Section 3.3.1, which ran on vulnerable virtual machines that were provided to each team. Exploiting a service would produce a flag, described in Section 3.3.2, which could then be used to launder the money into points. The launder process is described in Section 3.3.5. If the laundering was unsuccessful, the team lost their money and did not earn any points. Even when laundering was successful, however, the amount of points gained was not equal to the amount of money laundered: two factors, the payoff and cut (described in Section 3.3.4) were used in determining the amount of point gained. When laundering money into points, the chance of success depended on the risk factors, described in Section 3.3.4, associated with the service from which the flag being used for the laundering was acquired.
The competition was divided into ticks, each of which lasted two minutes. Every tick, the state of the game changed. At
| Service Name | Description |
|---|---|
| convicts | A restricted bash shell, exposed remotely over tel net. The restrictions did not include the exec com mand, with which it was possible to read the flag. |
| egoats | A Ruby-on-Rails e-commerce web application. In a two-step attack, it was possible to first control the id of a payment transaction, and then to re trieve credit-card information of other users. |
| mailgateway | A SMTP-like service, with a heap-overflow vulner ability. |
| msgdispatcher | A bulletin-board service, with a path-traversal vul nerability. |
| muleadmin | A website to manage money-laundering mules. Due to a bug in authorization enforcement, it was possible to read other users data. |
| mulemanager | A job-hunting website in PHP that the mules use to advertise their services. Some testing function alities were not disabled: through those, it was possible to retrieve the flag. |
| mulemassage appointment |
A website with obfuscated JavaScript, in which the flag was hidden. |
| muleuser | A website offering a messaging system for mules. Flags could be retrieved by using the XML-HTTP API, left enabled by the developers. |
| sendalert | A web application used by mule managers to send important alerts to the mules. Flags could be ob tained with an SQL injection attack |
| smsgateway | A binary service to send short messages to the mules. It could be exploited via a return-into-libc attack |
Table 1: Vulnerable services that the teams had to run on their machine while simultaneously exploiting the service's of the other teams.
each tick, the risk factors, payoff, and cut changed randomly for each service. With this design, we were able to study changes in the teams' risk-reward trade-offs throughout the competition.
3.3 Design Details
The 2011 iCTF experiment required a carefully-planned infrastructure, which was designed and deployed for maximum network performance and uptime.
3.3.1 Services
Each service was a network application, run by the participants on their networks, which included intended security vulnerabilities. A team had to exploit such vulnerabilities in the services of other teams, while protecting their own services from exploitation. The teams ran these services in a virtual machine that we provided to them so that they could connect it to the competition network.
We ensured that teams kept their services available by exercising their functionality with a scorebot that would connect to each teams' services and verify that they were functional.
For the 2011 iCTF, we created 10 services with intended vulnerabilities ranging from logic bugs to memory corruption flaws. Table 1 contains a description of each service, along with the vulnerability present in the service.
3.3.2 Flags
Each service has access to a flag, which the attacker must capture by exploiting the services. This flag is proof that the attacker exploited the specific team's service. For example, the flag of a message board service might be the password of a specific user. To recover the flag, an attacker would have to compromise the service to the point of being able to recover user passwords. To require teams to continue carrying out
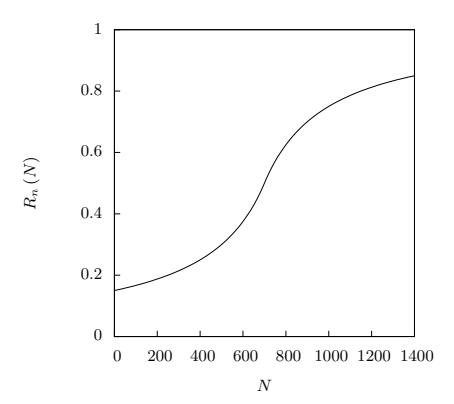
Figure 1: Graph of risk as N increases. The x-axis is the total amount of money previously laundered through the team, N, and the y-axis is the factor of risk from N.
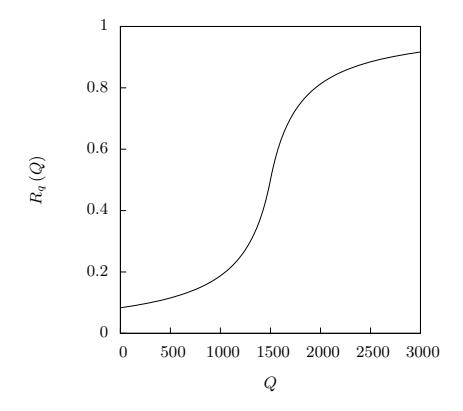
Figure 2: Graph of risk as Q increases. The x-axis is the total amount of money previously laundered through the service, Q, and the y-axis is the factor of risk from Q.
successful attacks, these flags were changed every tick by our scorebot in the course of exercising the services.
3.3.3 Challenges and Money
In order to utilize the flags recovered from services, a team first had to solve several self-contained security challenges to generate money. We hosted these challenges, and the teams could access the challenges through a challenge board. The typical challenge consisted of a single file and a question. Successful analysis of the file (or analysis of the web page referred to in the link) would yield the key in the form of a string to be entered into the challenge submission form. For example, several challenges involved obfuscated binaries, with the answer being the value contained in some encrypted variable. Submission of this value into the web form would net the submitting team an amount of money that depends on the difficulty of the challenge.
3.3.4 Risk
Risk, in the context of our competition, is the probability that a team successfully converts money into points. There are four factors that influence a team's laundering success, each designed to capture a different aspect of risk. The resulting risk function is a percentage from 0% to 100%, and the risk was the chance that the laundering was successful.
The risk factors must be considered in the context of two participating teams, with the attacking team attempting to launder money through a service of the defending team.
The first factor, R, is the service-specific risk, which varies randomly from zero to one at every tick. This factor is meant to capture the inherent riskiness of laundering.
The second factor, M, is the amount of money the team is trying to launder. The team chooses the amount of money to launder, and the idea here is that the more money the team tries to launder, the larger the risk of getting caught is. Thus, the teams had to balance laundering more money, at possibly favorable conditions but higher risk, or laundering less money.
The third factor, N, is the total amount of money that the attacking team has laundered through the defending team. For each laundering attempt, the attacking team must exploit the defending team's service. The idea here is that using one defending team, or money mule, over and over increases the risk of getting caught. This factor also had the added benefit of forcing the teams to spread out the laundering among multiple teams.
The fourth factor, Q, is the total amount of money the attacking team has laundered through that service. For each laundering attempt, the team must exploit another team's service. The idea here is that using one service, or laundering method, over and over increases the risk of getting caught. This factor also had the added benefit of rewarding teams for crafting exploits for more services, because the new services could be used for laundering at a lower risk.
Each of these parameters are directly related to risk, in much the same way that real-world risk shifts. For instance, trying to launder more money (M in our case) increases the chances of getting caught.
The overall risk function, O, averages three different risk attributes to encode the intuitions described previously.
The service-specific risk, R, is combined with the amount of money laundered, M, in the following way:
\[\frac{R \cdot M}{10}\]In this way, as the service-specific risk, R, decreased, the team could launder more money, M, for the same overall risk. The factor of 10 was decided to encourage the teams to keep the amounts to launder small.
The risk associated with the total amount of money the team has laundered through that team, N, is given in the following sigmoid function:
\[R_n(N) = \frac{1}{2} \left( \frac{N - 700}{300 + |N - 700|} + 1 \right)\]In this way, as the team laundered more and more money through the given team, the risk factor associated with N will increase slowly from 0.1 when N is 0, to 0.5 when N is around 700, and then greatly increase from there to 0.9. Figure 1 shows this function as N increases.
The total amount of money that the team has laundered through that service, Q, is given by a function that is similar to N, except that the inflection point is around 1, 500 instead of 700. This allowed the teams to launder more money through a service before it became significantly riskier. The
function for Q is as follows, and Figure 2 shows this function as Q increases:
\[R_q(Q) = \frac{1}{2} \left( \frac{Q - 1500}{300 + |Q - 1500|} + 1 \right)\]Finally, the overall risk, O, is calculated based on the amount of money the team decided to launder, M, the servicespecific risk, R, the total amount of money laundered through the team, N, and the total amount of money laundered through the service, Q as follows:
\[O\left(R,M,N,Q\right) = \frac{1}{3} \left[ \left( \frac{R \cdot M}{10} \right) + R_n\left(N\right) + R_q\left(Q\right) \right]\]Thus, when a team attempted to launder money, the function O was calculated to give a value between 0 to 1 on the chance of getting caught. Thus 0.3 meant that there was a 70% chance of successfully laundering from money to points, while there was a 30% chance of losing the money.
If the laundering is successful, then the amount of dirty money the team laundered is converted into clean points. Specifically, from the amount of money the team attempted to launder, M, a percentage of it is removed and given to the team that owned the service that was exploited. This percentage is called the cut, C, a service- and tick-specific value. The cut represents payments to, for example, the money mules themselves, and serves to funnel money into teams that might otherwise solve fewer challenges, allowing such teams to launder this money. Next, the resulting dirty money is further reduced by another service- and tick-specific value called payoff, P, which represents the effectiveness of the laundering process (specifically, the idea that any money laundering process has procedural overhead other than money mule salaries). Finally, in order to encourage teams to keep their services up and running, the final amount is further reduced by the percentage of time that the team's services have been up, D. The specific function is given next:
\[Points = (M - (M * C)) * D * P\]The cut and payoff create another dimension of "risk": laundering money through a service with a high cut or payoff but low risk in a given tick could be less beneficial than waiting until the service has smaller cut or payoff values, even at the cost of a higher risk.
If the conversion failed, the team would lose the money that it attempted to launder.
New, random, CP R values (Cut, Payoff, and Risk) for every service were given to the teams every tick.
3.3.5 Laundering
The goal of the competition was to earn dirty money by solving challenges and convert it into clean points by laundering them through exploited services. When a team exploited a service, and had some money to convert, they would submit the captured flag to the submission server and choose an amount of money to launder. This submission server would calculate the risk as described in Section 3.3.4, roll a virtual die to determine if the attempt was successful. If the roll was successful, the submission server would calculate the appropriate gain in points by the teams involved, and adjust
| Team Name | Ch | Mo | Ser | La | P | Co |
|---|---|---|---|---|---|---|
| We 0wn Y0u | 28 | 3,635 | 8 | 420 | 1,790 | 49 |
| MoreSmokedLeetChicken | 32 | 5,400 | 4 | 1,836 | 1,704 | 32 |
| FluxFingers | 28 | 4,285 | 6 | 185 | 1,105 | 26 |
| PPP | 27 | 3,825 | 3 | 451 | 965 | 25 |
| CISSP Groupies | 19 | 2,890 | 3 | 1,485 | 926 | 32 |
| ENOFLAG | 20 | 2,750 | 6 | 1,246 | 835 | 30 |
| Pwnies | 21 | 3,125 | 3 | 485 | 827 | 26 |
| PeterPEN | 23 | 3,600 | 5 | 96 | 671 | 19 |
| FAUST | 26 | 2,885 | 5 | 646 | 644 | 22 |
| HackerDom | 19 | 2,690 | 3 | 628 | 602 | 22 |
Table 2: Team performance. The number of challenges solved (Ch), the amount of money earned (Mo), the number of services exploited (Ser), the number of times the team laundered (La), the amount of points laundered (P), and the conversion ration (Co, in percent) for the top 10 teams in the competition.
| Service Name | Fl | Sub | Att | Def | Pts |
|---|---|---|---|---|---|
| convicts | 5,927 | 18,212 | 31 | 48 | 1,035 |
| egoats | 6,375 | 13,220 | 17 | 54 | 1,404 |
| mailgateway | 5,237 | 6,385 | 4 | 43 | 197 |
| msgdispatcher | 489 | 495 | 6 | 40 | 67 |
| muleadmin | 6,801 | 47,104 | 64 | 68 | 6,636 |
| mulemanager | 7,519 | 34,684 | 53 | 72 | 7,127 |
| mulemassageappointment | 1,505 | 1,961 | 5 | 56 | 232 |
| muleuser | 2,417 | 2,951 | 8 | 44 | 168 |
| sendalert | 2,833 | 5,526 | 22 | 55 | 4,243 |
| smsgateway | 1,947 | 1,947 | 3 | 7 | 7 |
Table 3: Service statistics. The number of captured flags (Fl), submitted flags (Sub, not unique since multiple teams could submit the same flag), teams with functional exploits (Att), teams that were exploited (Def), and total points earned (Pts) for every service.
points accordingly. However, if the laundering failed, the team would simply lose its money.
4 Data Analysis
The 2011 iCTF competition was attended by over 1,000 students in 89 teams from around the world. All teams were from academic institutions, spread across 18 countries. The teams generated an enormous amount of traffic, totaling 241 gigabytes over 8 hours.
Of the 51 challenges presented via the challenge board, 45 were solved by at least one team. 72 teams were able to solve at least one challenge, with an average of 13.5 challenges solved by each team. Team More Smoked Leet Chicken solved 32 challenges, while the first place team, We 0wn Y0u, solved 24. A summary of the top 10 teams who solved challenges, earned money, and laundered points is presented in Table 2.
Through analysis of the network traffic and scoring data, we were able to conclude that all services were successfully exploited during the competition. A summary of the services and their exploitation statistics is presented in Table 3.
It is important to emphasize that strategy and risk awareness was critical for success in the competition. This is evident by the fact that neither the amount of solved challenges, nor the amount of exploited services, and not even the total number of flags submitted determined the outcome of the competition. Instead, a deep understanding and utilization of the rules was required for success.
In the rest of this section, we delve into the details of how exactly such an understanding looked, and how teams in the competition behaved. We will demonstrate that the teams did, in fact, play in a risk-aware fashion and, in turn, their awareness of risk reflected their final standings in the game.
4.1 Conversion Ratio
A crucial measure of a team's performance in our competition is their conversion ratio—that is, the percentage of money
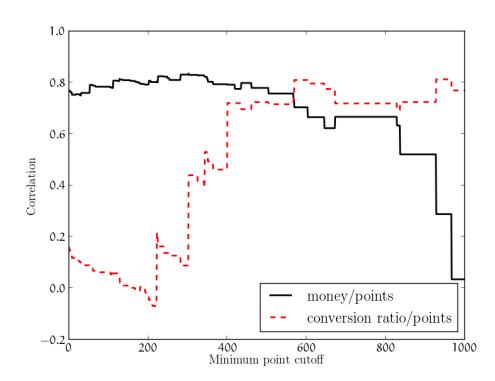
Figure 3: Relationship of the correlations between money and points and between conversion ratio for subsets of the teams, by point cutoff.
that they were able to convert into points. While this is not the only deciding factor in a teams' final performance (for example, it is obvious that the team needs money to launder into points), we feel that it is an extremely important one. It is intuitive that, with a low conversion ratio, even a team that solves all of the challenges in the competition could fail to achieve a large amount of points.
We calculated the correlation, defined as the covariance of two variables divided by the product of their standard deviations, between conversion ratio and the final point value for the top 10 teams. This resulted in a correlation coefficient of 0.81 between the conversion ratio and the final point values. In contrast, the correlation coefficient between the amount of money earned and the final point values is only 0.70. While both money and conversion ratio are obviously correlated to the final amount of points (and, thus, the final ranking), the conversion ratio is clearly a more important measure of success. To validate this hypothesis further, we examined the correlation for all teams in the competition, as opposed to only the top 10. We calculated the correlation at different point cutoffs, with a point cutoff of 0 including every team that scored points (a total of 62), and a point cutoff of 1,000 excluding all but the top three teams. We present the result in Figure 3.
The correlation between conversion ratio and points becomes more significant than the correlation between money and points at a points cutoff of 567. This cutoff excludes all but the top 11 teams. From this we conclude that at all but the highest level of the competition, money was the deciding factor for competition placement. However, past a certain level, conversion ratio becomes the dominating variable, becoming relatively more and more important as we limit the analysis to the top-scoring teams.
4.2 Risk Analysis
Analysis of the dataset leaves no doubt that teams had different thresholds as to what they felt was acceptable risk. It is interesting to examine how this threshold changed for teams throughout the competition. In Figure 4, we present the risks at which the top 5 teams laundered money throughout the competition. It is apparent that the beginning of the competition was rather chaotic for the teams. Those teams that captured flags early in the competition laundered them at varying amounts of risk, and all teams seemed to have experimented with higher-risk laundering in the middle of the game. However, three of the top four teams seem to have
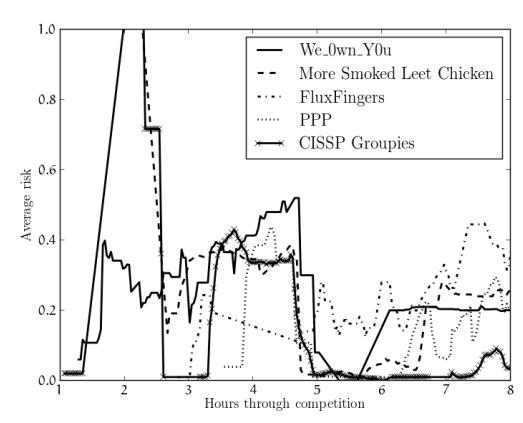
Figure 4: The risk thresholds for the top 5 teams over the course of the competition, averaged over a sliding window of 20 minutes. A risk of 0 means guaranteed success, and a risk of 1 means certain failure.
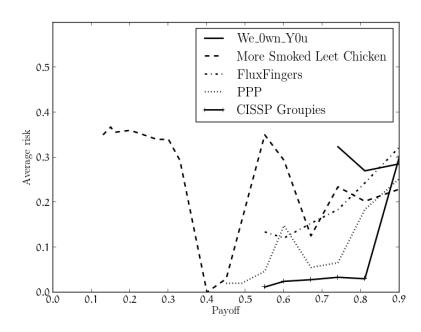
Figure 5: The risk thresholds for the top 5 teams for different payoff (P ) values. A risk of 0 means guaranteed success, and a risk of 1 means certain failure.
settled on a risk threshold between 0.2 and 0.3 (less than a 30% chance of losing their money).
The teams were willing to accept different amounts of risk for different levels of payoff. To visualize this, we calculated the average risk of all laundering attempts with different payoffs and plotted this for every team. As can be inferred from Figure 5, the teams had payoffs below which they would not launder and had higher risk thresholds for higher payoffs. In fact, the first-place team, We 0wn Y0u, did not attempt to launder if the payoff was less than 0.75. The strategic reader will note that the optimal laundering attempt would have a high payoff and a low risk, but such conditions were rare. As a result, each of the top teams created a different strategy as to what risk thresholds they would accept for what payoffs.
4.3 Expected Value Analysis
To gleam further insight into the individual team strategies, their evolution throughout the competition, and their effect on the final standing of the teams involved, we calculated the expected values of each laundering attempt. For every such attempt, the expected value is the amount of points that a team would expect to gain, statistically, from a laundering attempt after factoring in the CPR values as described in Section 3.3.4. For example, with a risk of 0.3, and a laundering success point value of 100 points, the expected value of the laundering attempt would be 30 points.
We first looked at the overall strategies of every team that attempted to launder money more than 200 times. This threshold was chosen to allow us to analyze teams that
actually took the laundering aspect of the game seriously, and teams with less than 200 attempts were unlikely to have laundered enough to develop a coherent strategy. Specifically, we wanted to compare how the expected values of the teams' laundering attempts were influenced by the amount of money that a team earned and, in turn, specifically how this affected the outcome of the competition. For each team, we calculated the expected value of each laundering attempt and plotted this for each team, in order of the final rankings. For a reference point, we included the amount of money that each team acquired throughout the competition.
This bar plot, presented in Figure 6 with first place on the left and last place on the right, reveals several interesting things. First, we see that the difference between the first and second-place teams were, again, largely influenced by their laundering strategy. Specifically, We 0wn Y0u, despite having considerably less money than More Smoked Leet Chicken, were able to maintain a very high expected return for their laundering attempts. This allowed them to more efficiently convert their limited money into a high amount of points. The attentive reader will notice that FluxFingers, the third-place team, actually had the highest average expected value in the game and had more money than the first-place team. However, as can be noted by the outliers of near-0 expected values, FluxFingers made a series of mistakes and wasted a considerable amount of money. The volume of these mistakes, which is lost in the way the graph presents information, makes this loss significant. The expected value was important on the lower end of the competition, as well. For example, HakM@rit was able to place higher than teams with more money by maintaining a high expected value. However, the difference in money between the top teams and the lower teams was too great to overcome with laundering strategy.
To dive deeper into the evolution of the teams' strategies throughout the competition, we analyzed the change in expected value of the top five teams. We calculated a 20-minute sliding window of the expected value of each of the top teams' laundering attempts. Figure 7 shows the changes in these expected values over the course of the competition. As expected, We 0wn Y0u, the first-place team, maintained the highest expected value for most of the competition. The second-place team spent the first two thirds of the competition with an extremely low expected value, using their sheer amount of money as a substitute for a good strategy. The teams' strategies seem to have evolved into a more stable approach to laundering as the competition progressed. We believe this is due to an increased understanding of the game, and the interface to the competition infrastructure, as the game continued.
4.4 Strategy Analysis
Due to the amount of variables in the risk function, and their dependence on the performance of other teams as well as previous laundering attempts, calculating an optimal strategy for our competition was a difficult challenge. The top three teams in the competition submitted summaries [2, 5, 12] of their experience during the contest, detailing their strategies, successes, and failures.
Because we released the idea behind the competition in advance, all of the teams entered the contest with some automation for the risk calculation. However, because the actual risk function was not released until shortly before the
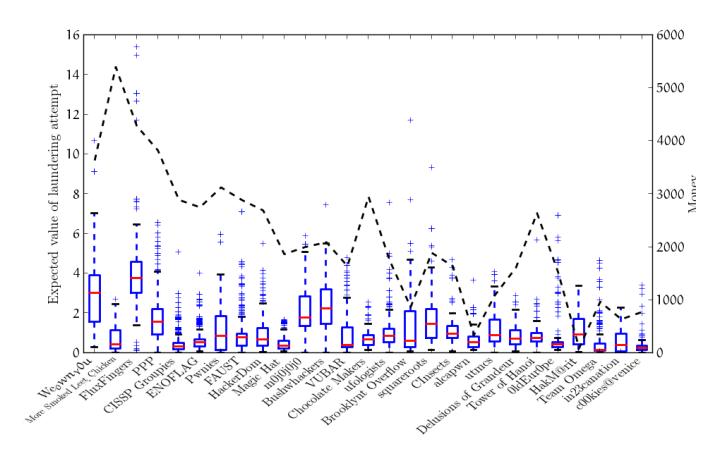
Figure 6: A whisker-plot of the expected values of the laundering attempts of every team that laundered more than 200 times. The expected value, labeled on the left Y axis, is the amount of points that a team would expect to gain from a laundering attempt after factoring in the CPR values. The money amounts of every team, labeled on the right Y axis and denoted with a dashed line, are specified as well, for a more complete analysis.
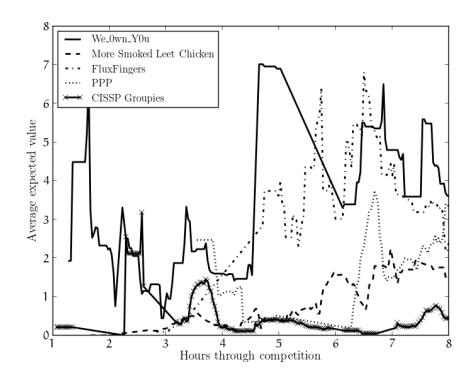
Figure 7: The expected values for the top 5 teams over the course of the competition, averaged over a sliding window of 20 minutes. The expected value is the amount of points that a team would expect to gain from a laundering attempt after factoring in the CPR values.
competition, the teams faced issues when actually attempting to use their automation. More Smoked Leet Chicken even went as far as handling the submission manually, looking at the output of the laundering service (as the final risk value was printed as a debug statement), and decide how much more money to launder through that service in that tick.
4.5 Case Study
For further insight into the importance of adapting a proper approach to risk management to a teams' final standing, we decided to do a case study of three teams with similar resources but different outcomes. The three teams we selected, Persistent Threat Hacking Club, CInsects, and VUBAR, had all gathered the same amount of money (1640) throughout the competition but, due to different risk management, finished the competition in very different positions. Specifically, Persistent Threat Hacking Club placed 33rd, CInsects placed 19th, and VUBAR placed 14th.
We analyzed these three teams using the same approach we used for the five top-scoring teams. We calculated the average risk that each team took, the average payoff that they accepted, and the change of their accepted risk over time and
| Team Name | Rank | Avg Risk | Avg Payoff |
|---|---|---|---|
| VUBAR | 14 | 0.058 | 0.87 |
| CInsects | 19 | 0.14 | 0.86 |
| PTHC | 33 | 0.27 | 0.57 |
Table 4: The rank, average risk, and average payoff for three selected teams in the competition.
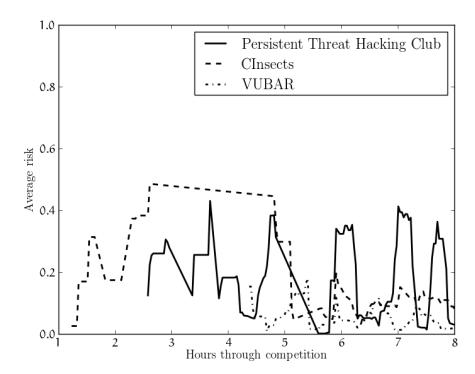
Figure 8: The risk thresholds for three selected teams over the course of the competition. A risk of 0 means guaranteed success, and a risk of 1 means certain failure.
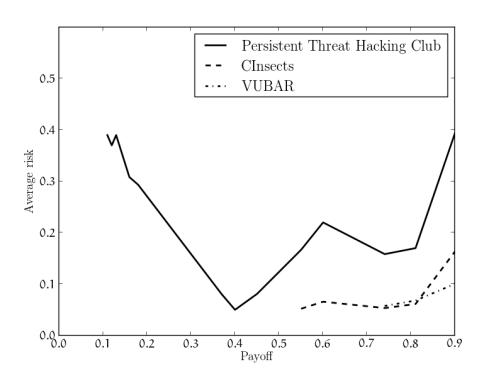
Figure 9: The risk thresholds for the three selected teams for different payoff (P ) values. A risk of 0 means guaranteed success, and a risk of 1 means certain failure.
across different payoff values. Our analysis confirmed our initial suspicions: among the three teams, a more consistent and conservative approach to risk led to a better standing in the final rankings. Specifically, it seemed that Persistent Threat Hacking Club, with an average risk of 0.27, did not have a specific strategy in terms of risk, with their risk threshold varying widely through time. On the other hand, VUBAR, with an average risk of 0.058, seemed to keep their risk tightly under control. Additionally, VUBAR didn't accept any payoff under 0.75, and only slightly raised their accepted risk when given a payoff of 0.9. Finally, CInsects settled for payoffs as small as 0.55 and let their risk soar when presented with high payoffs (see Table 4 and Figures 8 and 9).
5 Conclusion
Cyber-security competitions are often viewed as an entertaining exercise in which hackers can match skills against one another. However, such competitions can also be utilized to study interesting aspects of security incidents. In this paper, we presented a novel approach in utilizing a CTF competition to create a useful model of the risk-reward trade-offs present in such incidents. This approach, which was implemented to host a large-scale experiment involving over 1,000 players in 89 teams around from 18 countries, succeeded in generating a dataset that we hope will be useful for further study of such security activity. We described this approach in this paper and present some analysis of the dataset, showing that our experiment did encourage and record risk-aware behavior among the participants.
References
- [1] Z. Chen. Modeling the spread of active worms. In INFOCOM 2003. Twenty-Second Annual Joint Conference of the IEEE Computer and Communications. IEEE Societies, pages 1890– 1900, 2003.
- [2] M. S. L. Chicken. 2011 iCTF writeup. http://ictf.cs.ucsb. edu/archive/iCTF_2011/iCTF2011_MSLC_writeup.pdf.
- [3] M. Cova, C. Kruegel, and G. Vigna. Detection and analysis of drive-by-download attacks and malicious javascript code. In Proceedings of the 19th international conference on World wide web, WWW '10, pages 281–290, New York, NY, USA, 2010. ACM.
- [4] A. Doup´e, M. Egele, B. Caillat, G. Stringhini, G. Yakin, A. Zand, L. Cavedon, and G. Vigna. Hit 'em where it hurts: a live security exercise on cyber situational awareness. In Proceedings of the 27th Annual Computer Security Applications Conference, pages 51–61. ACM, 2011.
- [5] Fluxfingers. 2011 iCTF writeup. http://ictf.cs.ucsb.edu/ archive/iCTF_2011/iCTF2011_FluxFingers_writeup.txt.
- [6] G. Gu, P. Porras, V. Yegneswaran, M. Fong, and W. Lee. Bothunter: detecting malware infection through ids-driven dialog correlation. In Proceedings of 16th USENIX Security Symposium on USENIX Security Symposium, SS'07, pages 12:1–12:16, Berkeley, CA, USA, 2007. USENIX Association.
- [7] U. C. S. Lab. ictf 2011 dataset. http://ictf.cs.ucsb.edu/ data/ictf2011/.
- [8] N. Provos, P. Mavrommatis, M. A. Rajab, and F. Monrose. All your iframes point to us. In Proceedings of the 17th conference on Security symposium, SS'08, pages 1–15, Berkeley, CA, USA, 2008. USENIX Association.
- [9] M. Rajab, L. Ballard, N. Jagpal, P. Mavrommatis, D. Nojiri, N. Provos, and L. Schmidt. Trends in circumventing web-malware detection. Technical report, Google, Tech. Rep., Jul. 2011, ht tp://static. googleusercontent. com/external content/untrusted dlcp/research. google. com/en/us/archive/papers/rajab-2011a. pdf, 2011.
- [10] N. Stockman, K. Vamvoudakis, L. Devendorf, T. Hollerer, R. Kemmerer, and J. Hespanha. A mission-centric visualization tool for cybersecurity situation awareness. Technical report, University of California, Santa Barbara, August 2012, https://www.cs.ucsb.edu/research/tech reports/reports/2012- 07.pdf, 2012.
- [11] G. Stringhini, M. Egele, A. Zarras, T. Holz, C. Kruegel, and G. Vigna. B@bel: Leveraging email delivery for spam mitigation. In Proceeding of the 2012 USENIX Security Symposium, 2012.
- [12] We 0wn Y0u. 2011 iCTF writeup. http://ictf.cs.ucsb. edu/archive/iCTF_2011/iCTF2011_We0wnYou_writeup.pdf.